Grain Markets Buzz off Yields
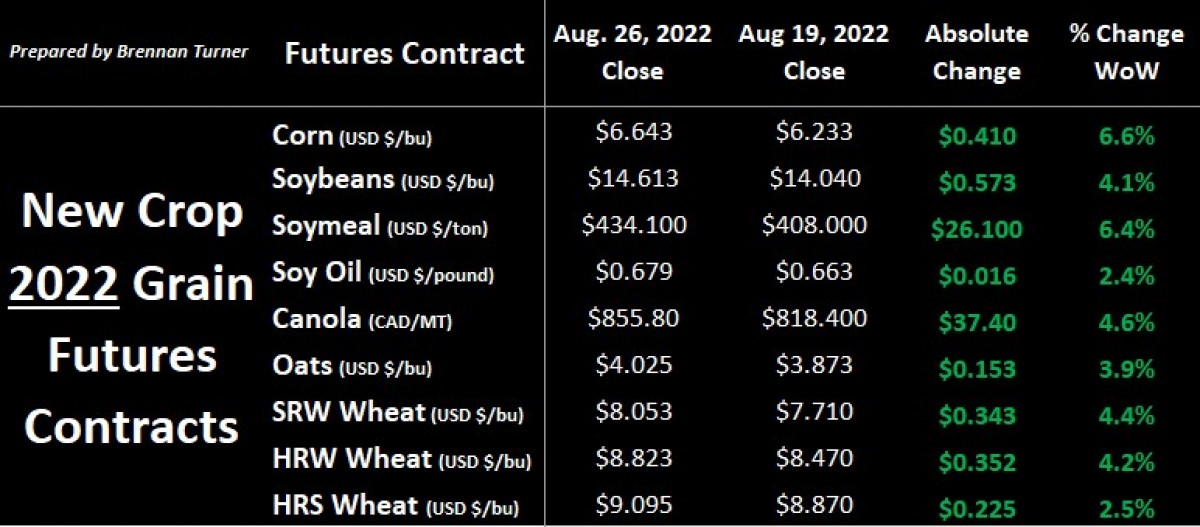
Despite ongoing interest rate hike talks, grain markets saw all green on the screen to finish the last full trading week of August, thanks to fund short-covering, dry pockets throughout the world, and bullish corn yield estimates from the ProFarmer crop tour that spilled into other commodities.
Ukrainian officials are bragging about nearly 1 MMT of grain getting exported in August, but most of it was corn, and obviously nowhere near the 3-5 MMT that they are telling the market is possible. Ultimately, with nearly 20 MMT of the 2022 Ukrainian wheat harvest taken off so far, Putin and Co. at the Kremlin seem very aware (read: in control) of just how much Ukrainian grain leaves through the Black Sea. Moving grain markets this coming week will be the USDA’s crop progress report, which will really be the last one markets will care about as crop conditions don’t change much in September, and Statistics Canada’s first production estimates (which I dig into below).
Staying in the Black Sea, Russian wheat exports in July and August are tracking nearly one-third below last year’s levels, with a “disappointing” 5.9 MMT shipped out, according to SovEcon. This would also be the lowest volume for the first two months of the new crop years since 2017/18, and is largely a function of Moscow’s rolling export tax and weaker domestic prices as a result of freshly harvested supplies coming to market. The Russian government argues that the export tax – which is updated weekly and currently sits at about $68 USD/MT or $88.60 CAD/MT or $2.41 CAD/bushel – helps maintain domestic market needs in addition to alleviating food price inflation. With weaker Russian exports, this might be supporting global wheat prices, but the greater variable coming from the Kremlin is the bullish impact a proposed February 2023 export quota system could have (yes, another one).
Corn futures posted their highest close in nearly two months after the ProFarmer crop tour went through close to 3,400 fields across seven states in the Corn Belt and Northern Plains, with more than 100 scouts tabulating kernel and soybean pod counts in every state. With a national corn yield estimate of 168.1 bu/ac, that’s notably lower than the government’s forecast of 175.4. This would put the total corn harvest at a touch under 13.8 billion bushels (or 349.5 MMT), thanks to the reality that better yields in Eastern Corn Belt states like Ohio, Indiana, Illinois, and even eastern Iowa won’t make up for the summer heat that non-irrigated fields in western Iowa, South Dakota, and especially Nebraska experienced. For soybeans, timely August rains keep yield potential up. Still, with the aforementioned dryness in a few areas, average yields are pegged at 51.7 bu/ac by ProFarmer, which isn’t far off from the USDA’s August estimate of 51.9.
Staying in yields, on Monday, August 29, Statistics Canada came out with their first model-based estimates of the Canadian harvest. The broader takeaway is that this year is a bigger harvest (duh), rebounding after last year’s drought, albeit StatsCan noted ongoing dry issues in parts of Saskatchewan, which I translate as the potential for future yield downgrades. Nonetheless, average Canadian durum yields were pegged by the government agency at 40.6 bu/ac, double that of a year ago, and more than 6 bushels above the five-year average (which technically includes last year’s paltry 20.2 bu/ac). Average Canadian spring wheat yields are estimated at 52.7 bu/ac, up 40% year-over-year. It’s worth noting that in last week’s Alberta crop report, the provincial agency estimated non-irrigated spring wheat yields at 53.2 bu/ac, so will the irrigated acres add another 5.3 bu/ac to the average yields in the Wild Rose province? My guess is no, but it’s also worth pointing out that average yields in Alberta saw a much bigger year-over-year rise than that in Saskatchewan and Manitoba.
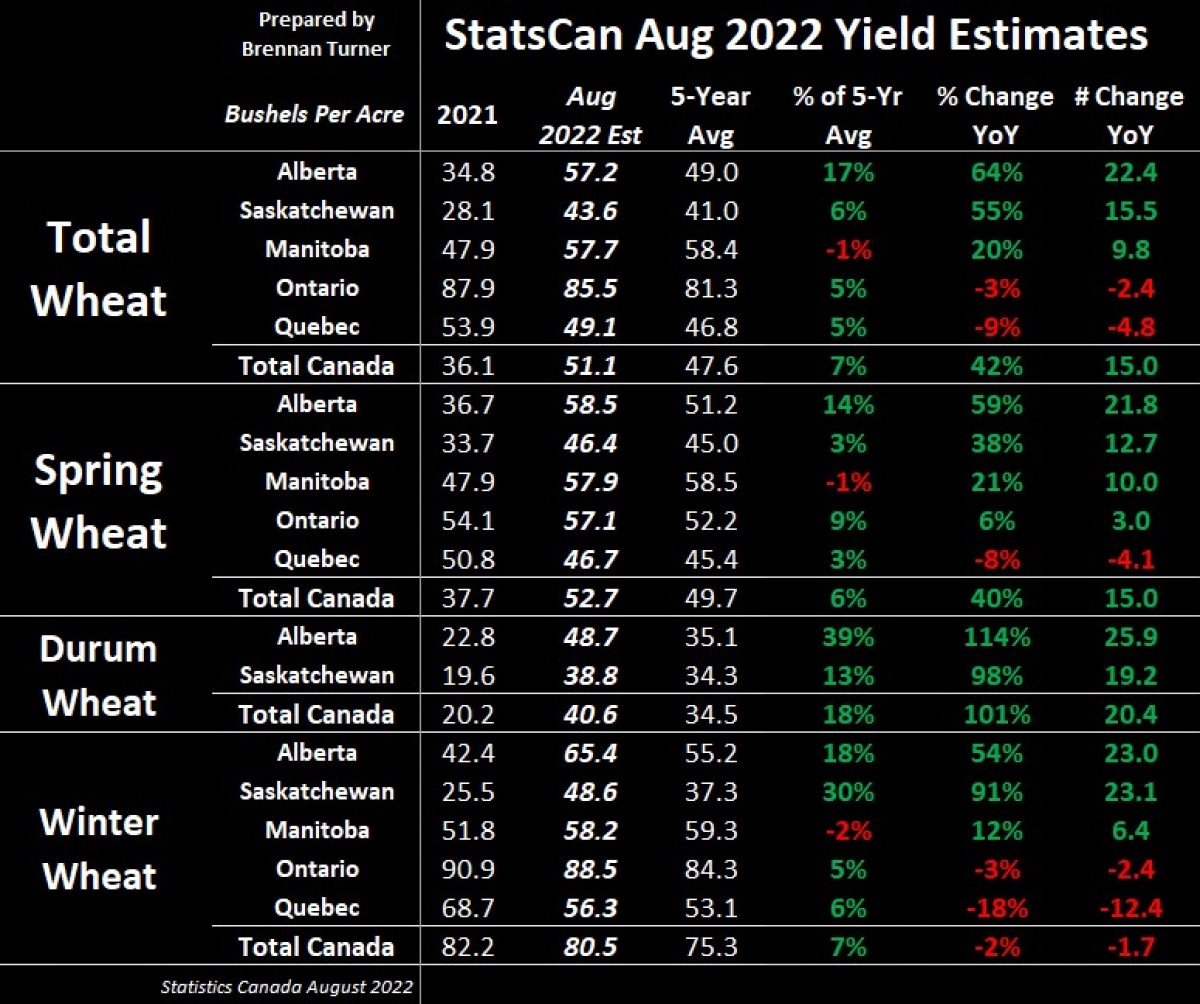
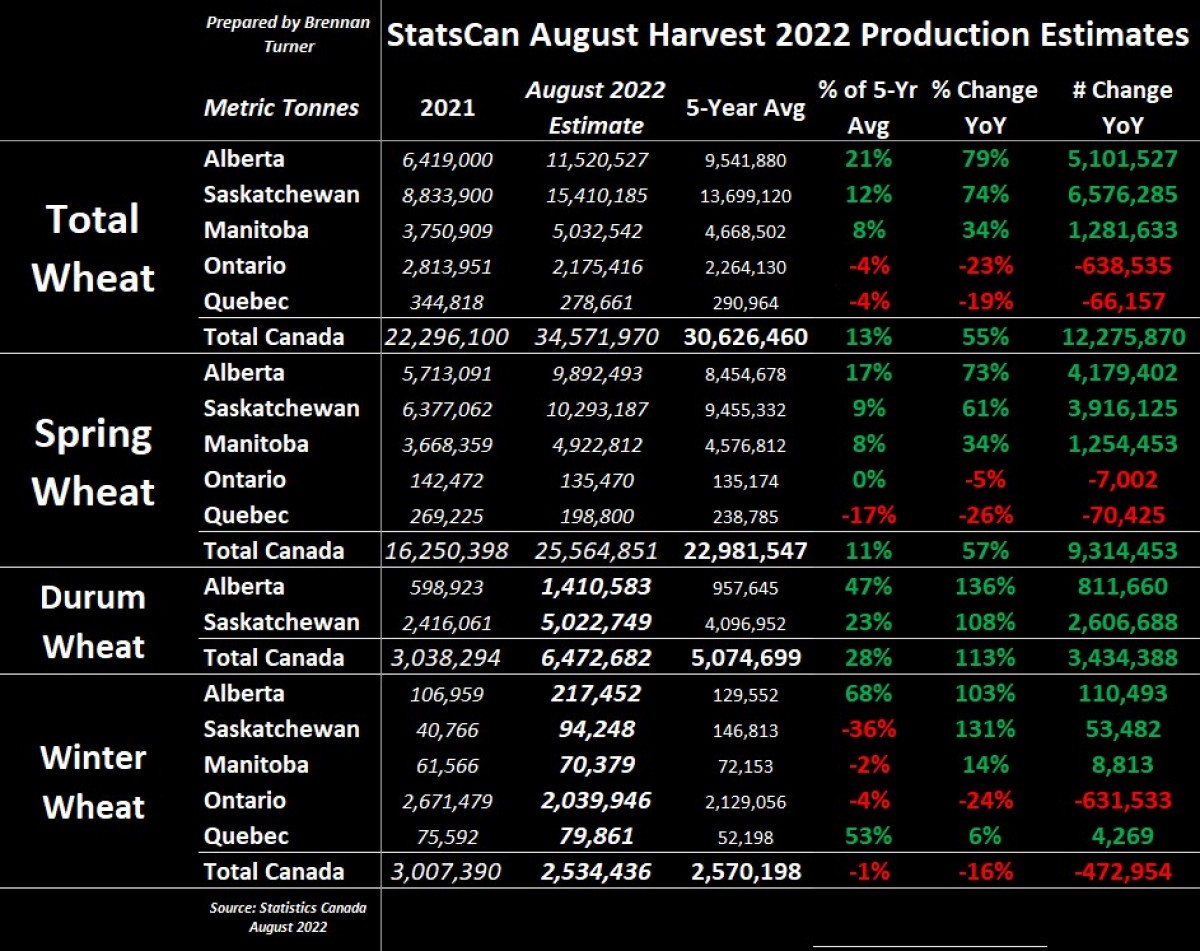
As a result, all types of Canadian wheat production are expected to climb 55% year-over-year to 34.6 MMT, slightly below the USDA’s last estimate of 35 MMT. Winter wheat production is down as Ontario farmers elected to pursue higher corn prices, but StatsCan is forecasting the durum harvest to more than double from Harvest 2021 to 6.47 MMT (thanks to the doubling of yields), and a spring wheat crop of 25.6 MMT, up 57% year-over-year. While this will set the goalposts (and likely lower cash wheat prices), these figures will be refreshed in just a few weeks as the next update from StatsCan’s model-based estimates comes out on Wednesday, September 14.
Before StatsCan published their estimates, Agriculture Canada came out with their updated supply and demand tables last week, using average durum yields of 39.1 bu/ac and 52.3 bu/ac for non-durum wheat (which is fairly close to Statistics Canada’s estimates that got published a few days later). Worth mentioning, however, is that durum yields were increased by 5 bu/ac from their July estimate, which jacked up production by nearly 800,000 MT to 6.27 MMT (again, StatsCan at 6.47 MMT). This helped increase exports by 600,000 MT to 5 MMT, and with domestic use slightly higher, Canada’s 2022/23 durum ending stocks were only pushed higher by 200,000 MT to 900,000 MT.
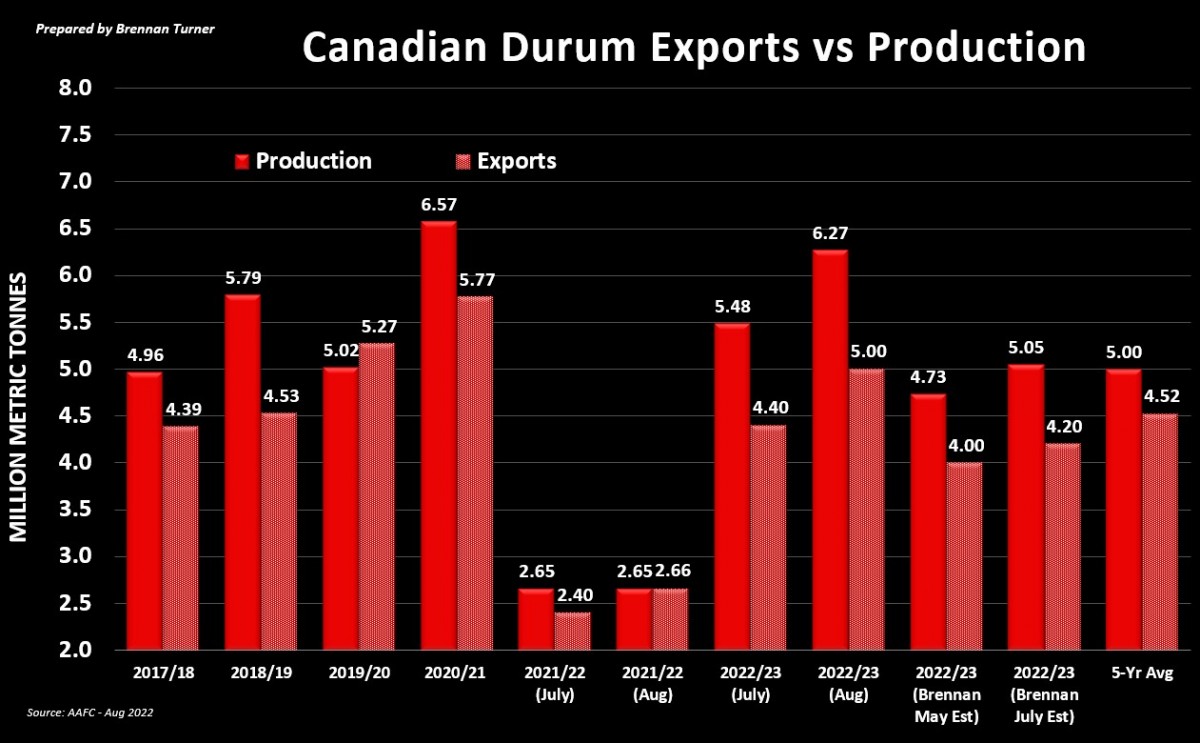
Worth noting is that the old crop, 2021/22 Canadian durum exports were raised by 260,000 MT from last month to 2.66 MMT, basically matching the totality of Harvest 2021! The International Grains Council recently noted that global durum 2022/23 carryout will come in at 5.5 MMT, down 11% from their July estimate, leaning into the stronger demand in Europe, North Africa, and the Middle East (but we already knew this!). For non-durum wheat, nothing really changed on the balance sheet, save for 500,000 MT more going into food & industrial use, and 500,000 MT less in the feed column (so it’s a wash!). AAFC’s non-durum wheat production estimate was stayed at 28.2 MMT, which is about 100,000 MT more than what Statistics Canada is currently estimating.
Wrapping things up, 95% of the US winter wheat crop is now in the bin (and on pace with seasonal averages), with a few fields in the Northern Plains and Pacific Northwest left to get cut. On the flip side, with the late planting start for most U.S. spring wheat farmers, harvest is tracking 21 points behind the seasonal average, with just 31% of American spring wheat fields combined. Are we turning the tide in wheat prices? Well, money managers ended a 13-week run of reducing their long position in KC HRW wheat futures, but maybe we should take it with a grain of salt as the speculative money still increased their net short position in Chicago SRW wheat. Next week, we’ll dig into the potential long-term impacts of this summer’s hot conditions in the northern hemisphere, and export potential, as well getting a refresher on the relationship between commodity prices and rising interest rates.
To growth,
Brennan Turner
Founder | Combyne Ag