
Fertilizer planning considerations
By Jeremy Boychyn MSc. P.Ag., Agronomy Research Extension Specialist | Alberta Wheat and Barley Commissions
In a season of fertilizer price extremes, it is natural for farmers to investigate opportunities to reduce fertilizer costs. A good way to approach fertilizer costs is to assess the likelihood of crop yield response to fertilizer application. This approach requires soil testing and field-by-field fertility assessment.
A properly sampled and soil tested field is essential to being efficient with fertilizer dollars. Arbitrary reductions in fertilizer application rates can be counter-productive and limit the ability to make the most of every fertilizer dollar. Conduct a soil test and assess field-by-field needs. Work with an experienced agronomist and outline realistic goals.
Phosphorus
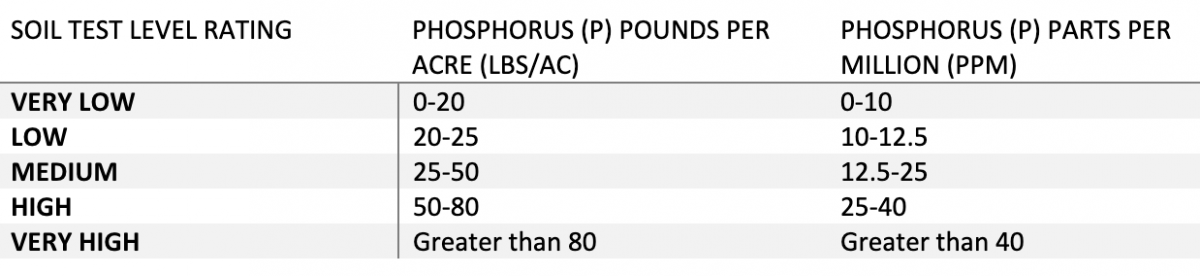
Phosphorus (P) is essential for early season wheat and barley growth. However, yield response to P application is largely dependent on the current soil P levels. In short, the lower your P soil levels, the greater probability that a crop will see significant yield increases to P application. About 80 per cent of annually cropped soils in Alberta respond to added P fertilizer. This is due to soil P levels typically falling in the medium or lower rating. Soil test ratings can be seen in Table 1, based on the modified Kelowna soil test P method.
Specific fertilizer recommendations based on the modified Kelowna soil test P levels and soil zone can be found here, in Table 6 for barley and Table 8 for wheat. The document (in Table 7 for barley and Table 9 for wheat) also outlines the probability of a two bushel or greater, and five bushels or greater yield response when applying recommended levels of P based on soil test levels. Research on P fertilizer application, based on soil test levels, indicates that soils ranked as low or medium have a 60 to 100 per cent chance of yield response to P application. Soils ranked as high in P have a 30 to 50 per cent chance of yield response when P fertilizer is applied.
If the soil has a high probability of response due to low soil P levels, it is recommended to apply P at recommended rates. If economics require a reduction in the total amount of P applied, it is recommended to apply a maintenance level of P. However, a reduction in P application may decrease the likelihood of crop response. Additionally, a reduction in P fertilizer may cause P to be a limiting factor in yield potential. Another consideration to keep in mind is soil P mining. If the amount of P applied for that crop is lower than what is removed in the grain at harvest, that soil is now at a P deficit for the season. In these situations, producers should account for that deficit in future applications to avoid long-term soil mining.
Potassium
Potassium (K) is like P in that probability of crop response depends on current soil levels. Typically, K deficiency is less common than P deficiency in Alberta. About 30 per cent of annually cropped soils in Alberta respond to added K fertilizer. Research conducted on barley investigated the number of responsive sites when K was applied. Sites demonstrating the largest increases in yield typically had less than 151 pounds (75.5 ppm) per acre of soil available K. In soils with K levels of 200 to 250 pounds per acre (100 to 125 ppm), K applications of 15 to 30 pounds per acre resulted in yield responses 18 per cent of the time. Soils with K levels above 250 pounds per acre (125 ppm) displayed yield response only 3 per cent of the time.
This probability of response is important to consider when fertilizer prices are high. However, like P, if the amount of K applied for that crop is lower than what is removed in the grain at harvest (or any straw that is baled and removed), the soil will be deficient in K at the end of the season. Depending on current soil K levels, this mining may need to be accounted for to ensure long term K deficiency is avoided.
Nitrogen
Nitrogen (N) carryover into the 2022 season may be greater than normal due to the lack of rainfall in 2021. Assessing how much N is available is best done by soil sampling at the 0 to 15 cm (0 to 6 inch), 15 to 30 cm (6 to 12 inch) depths and the 30 to 60 cm (12 to 24 inches). Sampling should be done to the 60 cm (24 inch) depth to accurately assess N. Soil test results will provide information on nitrate (NO3-) and expected nitrogen release (ENR). Nitrate is a form of freely available plant N. ENR is the amount of N expected to release from organic matter (OM) during the upcoming growing season for crop use. It is important to note that ENR is dependent on favorable environmental conditions for mineralization to release organic N into plant-available forms of N. Moisture and temperature will affect the rate of mineralization. Therefore, a dry season means less mineralization and less N being released.
To develop a N rate based on the soil tests, combine the total available nitrogen in the soil and use that value against the total N needs based on realistic yield goals. The N application rate for the field will be the total N needs based on yield goals minus the soil available N at different depths. If you are unsure of yield expectations, work with an experienced local agronomist. Also note that there are diminishing returns from incrementally higher N application rates. For example, the first 50 lbs of N fertilizer will contribute more to yield than the next 50 lbs of N fertilizer applied.
Sulphur
Plants take up sulphur (S) in the sulphate (SO4-S) sulphur form. Sulphur is the third most limiting nutrient in Alberta following N and P. Like nitrate nitrogen, SO4-S is mobile in the soil and will readily leach. To test soil S levels, collect soil samples from 0 to 6, 6 to 12 and 12 to 24 inches (0 - 15, 15 - 30 and 30 - 60 cm) depths.
The main source of soil S is release from soil OM. Therefore, areas that are sandy and low in OM are particularly at risk of sulphur deficiencies. Additionally, soils prone to S deficiency are thin Black, Black and Gray Wooded soils. This is due to higher rainfall leading to increased yields but also greater leaching potential. Brown and dark brown soils subsoils contain gypsum (CaSO4·2H2O) providing S for growing crops. However, crop deficiency may occur before plant roots reach the subsoil. Considering all these factors affecting S availability in different soil zones, producers must be aware of the potential soil conditions leading to sulphur deficiency on their land.
Understanding crop sulphur (S) need through a soil test is less reliable. This is due to the inherent variability of soil S. Soil S can vary greatly (this is usually a greater concern in southern Alberta in areas with slight to moderate salinity which increases the sulphate level) within the same field. This can lead to soil tests indicating adequate levels of S but areas deficient in S may still exist.
Considering all these factors, reducing S applications in a high fertilizer cost year is particularly challenging. Producers should consider maintaining a base level of S to meet yield goals and while limiting sulphur deficiency. Review the Alberta Agriculture Sulphur Application in Crop Production Agri-Facts for more information.
Summary
When assessing fertilizer plans in a year where fertilizer costs are high, there are a few things to keep in mind. First, soil tests will be vital to understanding soil needs and expected crop response from applications of specific nutrients. Second, the probability of response is important to keep in mind. The higher the probability of crop response to a nutrient application, the greater the value the fertilizer application. However, if a crop response is not expected, as indicated by a soil test, a reduction of application rates may be considered. In these situations, it is important to consider the law of the minimum. The law of minimum indicates that the most limiting nutrient will limit the yield potential. In other words, if applying enough nitrogen for a 55 bu/ac wheat crop but only applying enough phosphorus for a 30 bu/ac wheat crop (including soil availability), the crop will be limited to 30 bu/ac based on P availability (assuming no other nutrients or factors other than P are limiting). Additionally, excess nitrogen is being applied in this scenario that will not be utilized as the crop will likely not reach 55 bu/ac. If the rate of one nutrient is reduced, understand what that means for the yield expectation and application rates of the other nutrients. Finally, if the soil test indicates crop yield response to phosphorus or potassium fertilizer is unlikely and reductions in application rates are planned, be aware that the risk of soil nutrient mining is higher. It is important to account for the application rates versus removal rates of nutrients each year to ensure fields are not being inadvertently mined over the long term.
Additionally, 4R nutrient management should also be a consideration when addressing high fertilizer costs. Ensuring the right place, right time, right source, and right rate will help to increase fertilizer dollar efficiency. For more information on 4R nutrient stewardship, see here.
Keep these considerations in mind to make the most of each fertilizer dollar.